More Cartopy Tiles Examples
Introduction
A previous post provided examples of Cartopy graphics, and its support for raster tiles. This post will continue the theme, and provide more examples.
Google Maps
A small example:
    fig = plt.figure(figsize=(10,10))

    tiler = GoogleTiles()
    mercator = tiler.crs
    ax = plt.axes(projection=mercator)

    ax.set_extent(( 153, 153.2, -26.6, -26.4))

    zoom = 12
    ax.add_image(tiler, zoom )

    # even 1:10m are too coarse for .2 degree square
    #ax.coastlines('10m')

    home_lat, home_lon = -26.5258277,153.0912987
    # Add a marker for home
    plt.plot(home_lon, home_lat, marker='o', color='red', markersize=5,
             alpha=0.7, transform=ccrs.Geodetic())

    plt.show()
After creating the matplotlib figure, we ask Cartopy to create a GoogleTiles object, We get the Coordinate Reference System (CRS) that the tiling service
uses, and create a Cartopy-aware Axes object using the CRS. We are pre-judging the system a little, in that the variable name mercator relies on us knowing
Google uses a Mercator projection (but Google could change tomorrow, and the code would work).
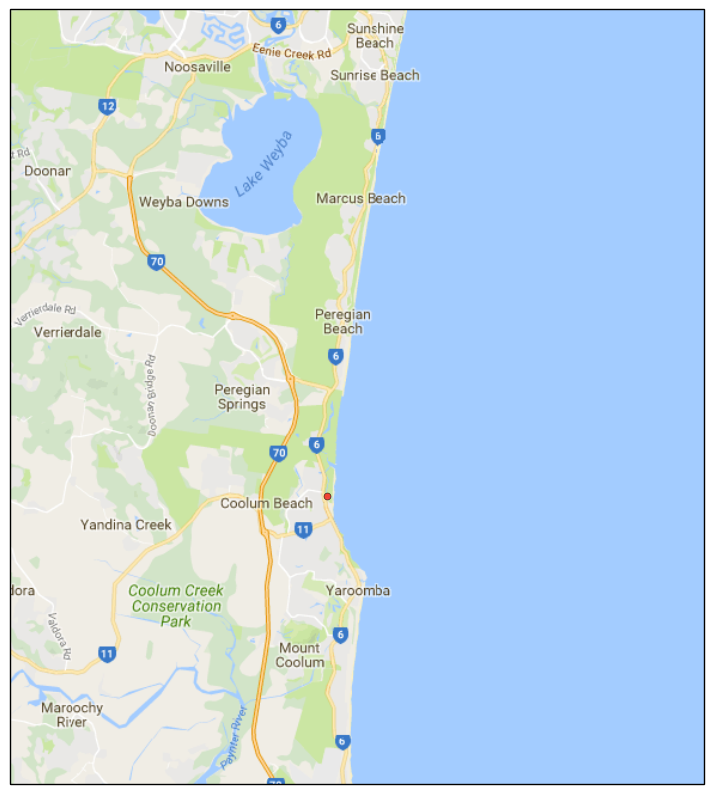
We then set the extent of our map to be my local stamping ground. Cartopy is smart enough to know that the extent (if specified without a CRS) is in lat/lon coordinates, even if the Axes object it is applied to is running a Mercator projection under the hood.
We the set a zoom level, and add the image that the tile server gives us to the Axes object. I have zoomed in quite a long way, so even the high quality coastlines don't match up to what Google gives us, so we skip drawing them. I don't know if Google or NaturalEarth are the more accurate. Then to demonstrate that this image can be used as an underlay for more graphics, I draw a red dot near where I live. Once again, I have to be careful to tell the Axes object that the coordinates I am feeding in are lat/lon coordinates.
The end result is below.
Stamen Terrain
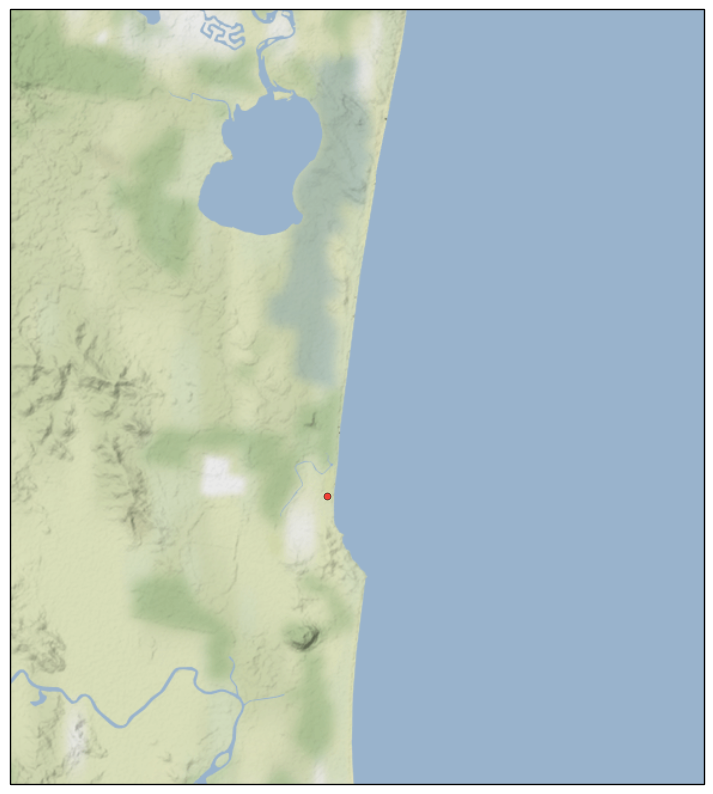
For some visualizations, having the underlying terrain visible would be more important that the cultural data of the Google Map Tile. Cartopy supports an interface to Stamen Terrain tiles services. The example is very similar to the one above
    fig = plt.figure(figsize=(10,10))

    tiler = StamenTerrain()
    mercator = tiler.crs
    ax = plt.axes(projection=mercator)

    ax.set_extent(( 153, 153.2, -26.6, -26.4))

    zoom = 12
    ax.add_image(tiler, zoom )

    # even 1:10m are too coarse for .2 degree square
    #ax.coastlines('10m')

    home_lat, home_lon = -26.5258277,153.0912987
    # Add a marker for home
    plt.plot(home_lon, home_lat, marker='o', color='red', markersize=5,
             alpha=0.7, transform=ccrs.Geodetic())

    plt.show()
The end result is below.
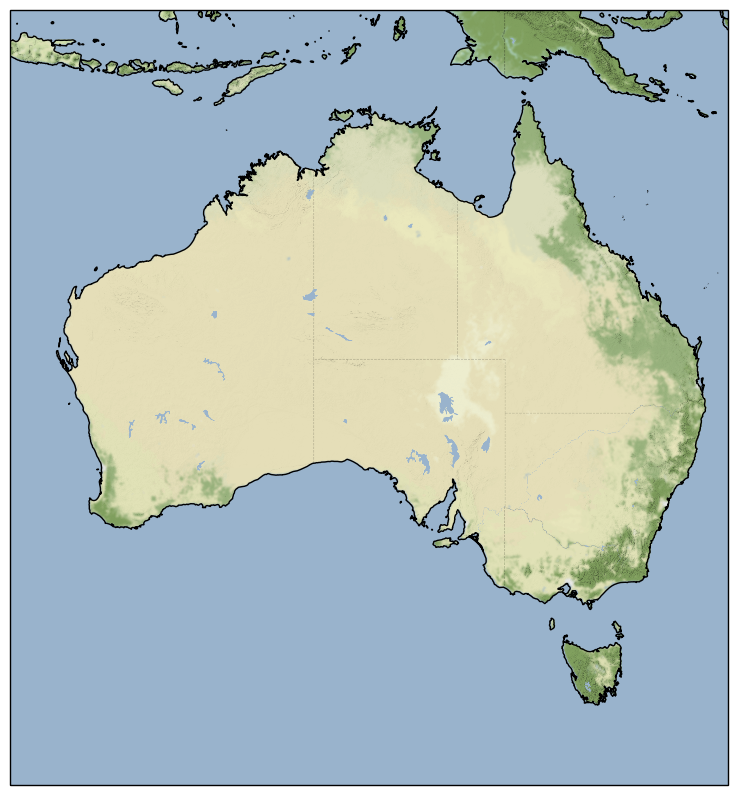
To illustrate a zoomed-back-out use of this service, in the next example, we show the whole of Australia.
    fig = plt.figure(figsize=(10,10))

    tiler = StamenTerrain()
    mercator = tiler.crs
    ax = plt.axes(projection=mercator)
    ax.set_extent((110, 155, -45, -5))

    zoom = 6
    ax.add_image(tiler, zoom )

    ax.coastlines('10m')
    plt.show()
Note the change in the zoom level. This gives us the graphic below (with no additions from me, this time).
Imports
Just for completeness, here are the imports from the Notebook that holds all the code above (and some code to come) (some are used only to support print-outs that define the environment for reproducibility purposes) :
    # all imports should go here

    import sys
    import os
    import subprocess
    import datetime
    import platform

    import pandas as pd
    import matplotlib.pyplot as plt

    import cartopy.crs as ccrs
    from cartopy.io.img_tiles import OSM
    import cartopy.feature as cfeature
    from cartopy.io import shapereader
    from cartopy.io.img_tiles import StamenTerrain
    from cartopy.io.img_tiles import GoogleTiles
    from owslib.wmts import WebMapTileService

    from matplotlib.path import Path
    import matplotlib.patheffects as PathEffects
    import matplotlib.patches as mpatches

    import numpy as np
The notebook that has all the code is here
Comment