Cartopy and MultiLine Geometries
Introduction
So, I set myself the challenge of visualizing Australia's oil and gas fields, and associated pipelines, as an exercise in learning Cartopy. I wound up learning more that I had anticipated.
The Australia Government provides shapefiles for oil and gas field locations, and for oil and gas pipelines. So far, so good.
So I downloaded the shapefiles, and the visualization of the oil and gas fields went fine. However, the pipelines visualization looked weird. A little poking around showed that the pipeline shapefile contained data that Shapely interpreted as a MultiLine geometry. Essentially, Shapely knows about Points, Lines, MultilinesStrings, Polygons, and MultiPolygons, and this was my first brush with Multilines.
The Problem
It turns out that Cartopy has decided that multi-point lines are really polygons in disguise. An example program that illustrates the problem is below.
    from shapely.geometry import MultiLineString

    lines = MultiLineString([((0, 0), (10, 10)), ((0, 20),  (10, 15), (15, 10), (20, 0))])
    print(lines)

    fig = plt.figure(figsize=(10,10))
    ax = plt.axes(projection=ccrs.PlateCarree(central_longitude=140))
    ax.set_extent((-10, 20, -10, 30))

    ax.add_feature(cartopy.feature.LAND)
    ax.add_feature(cartopy.feature.OCEAN)

    ax.add_geometries([lines], ccrs.PlateCarree(),\
                              edgecolor='green', facecolor=None, alpha = 0.8, linewidth=2)

    plt.show()
In this trivial example, we create a MultiLine (called MultiLineString by Shapely), that has two parts.
The first part is a simple Start Point to End Point line (((0, 0), (10, 10))). The second part is a line with
four points (i.e. a Start Point, and End Point, and two points in the middle - ((0, 20), (10, 15), (15, 10), (20, 0))).
We then crank up a Cartopy-aware Axes object, add Cartopy Land and Ocean features, and add the line geometry. The limits of the Axes are set to the area around the (0,0) point in lat/lon space where our lines are defined: i.e. near the west coast of Africa.
This results in:
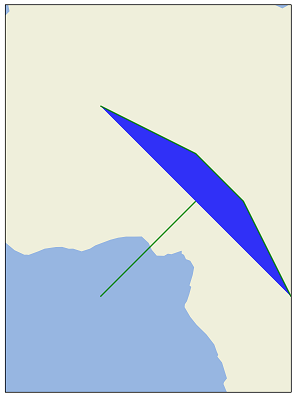
As you can see, the simple line was drawn just fine, but the multipoint line was filled in! And try as I might, I could not find the magic combination of parameters to instruct Cartopy not to fill this geometry.
So then I turned to Plan B. Here, I created a new geometry, based upon that read from the shapefile, but with simple lines replacing the multipoint lines. The relevant code fragment loooks like:
    # turn multipoint lines into simple start-end lines
    line_good=[]
    for l in lines:
        start_pt = list(l.coords)[0]
        for i in range(1,len(l.coords)):
           end_pt = list(l.coords)[i]
           simple_line = (start_pt, end_pt)
           line_good.append(simple_line)
           start_pt = end_pt
        #end for
    #end for

    lines = MultiLineString(line_good)
    for l in lines:
        ax.add_geometries([l], ccrs.PlateCarree(),\
                                  edgecolor='green', facecolor=None, alpha = 0.8, linewidth=2)
    #end for

    plt.show()
Here, in the outer for loop, we run through all Lines in our MultiLineString geometry. For each point in the Line, starting at the second,
we create a simple two point line, where the start point is the end point of the last simple line (i.e. all the simple two-point lines join up,
nose to tail, to recreate the multi-point line). We then create a new Shapely MultiLineString, and add it to the Cartopy-aware Axes object.
And voila!
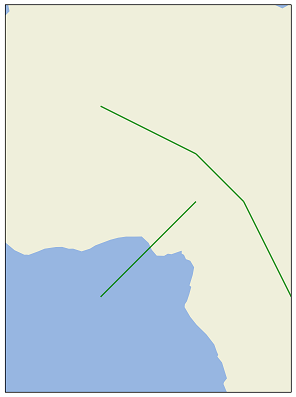
Now my lines are drawn as lines, not polygons. By the way, Google-ing around seems to indicate that some people think this Cartopy behaviour is by design, and is not a bug. I have lodged an issue on GitHub.
Back to my Map
So now I know how to draw lines from shapefiles, we return the to the original job.
Geographic data sources
First, we want a high quality map (and we do want a high quality map, because oil fields are quite small compared to the extent of Australia, so we will want to zoom in some. Accordingly we define some high quality mapping data, to be loaded from Natural Earth. In this case, 'high quality' mean using 1:10Million (not 1:100Million) data.
    BORDERS_10m = cartopy.feature.NaturalEarthFeature('cultural', 'admin_0_boundary_lines_land',
                                  '10m', edgecolor='black', facecolor='none')
    """country boundaries."""

    COASTLINE_10m = cartopy.feature.NaturalEarthFeature('physical', 'coastline', '10m',
                                    edgecolor='black', facecolor='none')
    """coastline, including major islands."""

    LAKES_10m = cartopy.feature.NaturalEarthFeature('physical', 'lakes', '10m',
                                edgecolor='face',
                                facecolor=cartopy.feature.COLORS['water'])
    """ natural and artificial lakes."""

    LAND_10m = cartopy.feature.NaturalEarthFeature('physical', 'land', '10m',
                               edgecolor='face',
                               facecolor=cartopy.feature.COLORS['land'])
    """land polygons, including major islands."""

    OCEAN_10m = cartopy.feature.NaturalEarthFeature('physical', 'ocean', '10m',
                                edgecolor='face',
                                facecolor=cartopy.feature.COLORS['water'])
    """Small scale (1:110m) ocean polygons."""

    RIVERS_10m = cartopy.feature.NaturalEarthFeature('physical', 'rivers_lake_centerlines', '10m',
                                 edgecolor=cartopy.feature.COLORS['water'],
                                 facecolor='none')
    """single-line drainages, including lake centerlines."""
Cartopy will download this data on first use, and cache it. The first time you use a feature that triggers a download, you get a warning:
    D:\Anaconda3\lib\site-packages\cartopy\io\__init__.py:264: DownloadWarning:
    Downloading: http://naciscdn.org/naturalearth/10m/cultural/ne_10m_admin_0_boundary_lines_land.zip
      warnings.warn('Downloading: {}'.format(url), DownloadWarning)
Create the map background
Then we create the fancy map, upon which our visualization will be drawn.
    fig = plt.figure(figsize=(10,10))
    ax = plt.axes(projection=ccrs.PlateCarree(central_longitude=140))
    #ax.set_extent((110, 155, -45, -5))  # whole of Australia
    ax.set_extent((120, 132, -18, -6))   # NE Australia to E Timor

    ax.gridlines(draw_labels=True)

    ax.add_feature(LAND_10m)
    ax.add_feature(OCEAN_10m)
    ax.add_feature(COASTLINE_10m)
    ax.add_feature(RIVERS_10m )
    ax.add_feature(BORDERS_10m )
First, we create a matplotlib figure, and then a Cartopy-aware Axes object. We choose to constrain our map to just around
North West Australia (the sharing of oil and gas resources with East Timor is currently an on-going dispute with East Timor).
We draw gridlines, and add the geographical features to provide context for our visualization. We decided not to use the
LAKES_10m feature.
Read the oil field shapefile
    print('Adding gas fields ...')
    add_shp = '../data/fields'

    shp = shapereader.Reader(add_shp)
    add_s = shp.records()
    ADD_alpha = 0.99

    for add in add_s:

        if( add.geometry == None):
            pass
        else:
            ax.add_geometries([add.geometry], ccrs.PlateCarree(),\
                              edgecolor='red',  facecolor='tan', alpha = ADD_alpha)
        #end if

    #end for
We create an instance the Cartopy shapereader, and use it to access the records in the shapefile. For each shape,
we check to see if the record geometry is None (the equivalent of missing data); if not, we add it to the Cartopy map,
with our chosen color. We set alpha to be close to 1.0, so that they show out.
Read the pipeline shapefile
    print('Adding pipelines ...')
    add_shp = '../data/pipelines'

    shp = shapereader.Reader(add_shp)
    add_s = shp.records()
    ADD_alpha = 0.99

    for add in add_s:

        if( add.geometry == None):
            pass
        else:
            lines = add.geometry
            line_good=[]
            for l in lines:
               start_pt = list(l.coords)[0]
                for i in range(1,len(l.coords)):
                   end_pt = list(l.coords)[i]
                   simple_line = (start_pt, end_pt)
                   line_good.append(simple_line)
                    start_pt = end_pt
                #end for
            #end for
            lines = MultiLineString(line_good)

            ax.add_geometries([lines], ccrs.PlateCarree(),\
                              edgecolor='green', facecolor=None, alpha = ADD_alpha)
        #end if

    #end for

    plt.show()
This code matches the previous example, except for the the trick of unravelling the multi-point lines into simple nose-to-tail lines. We add this newly created geometry to the underlying map, giving the line a distinctive color.
The Result
The result of this is shown below.
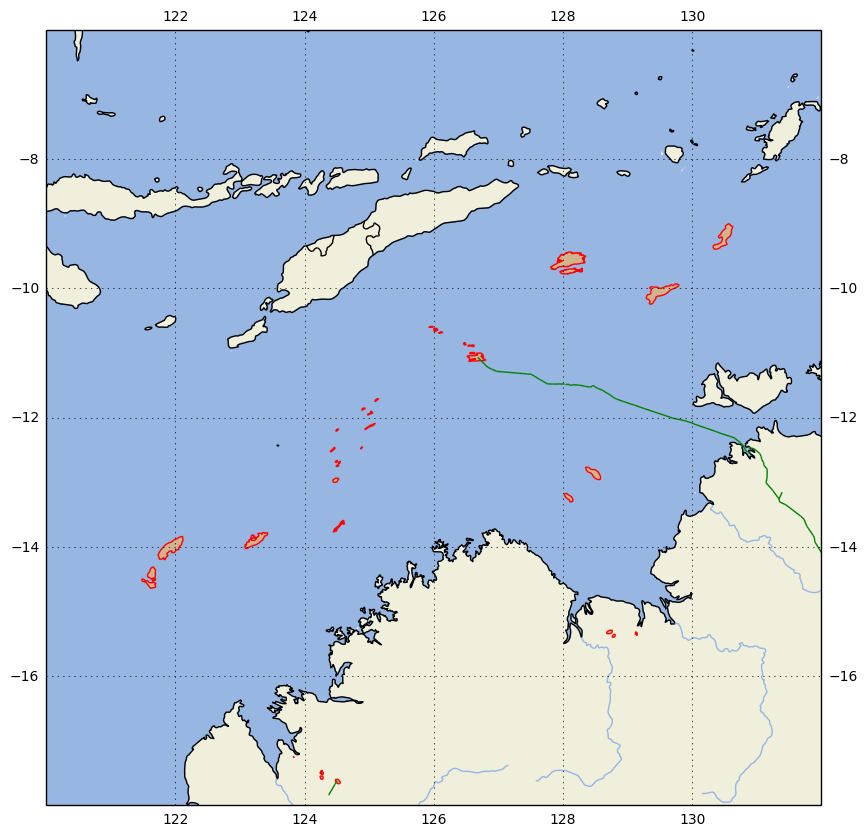
It would be interesting to show the edge of the continental shelf, and Australia's Economic Zone border. I have downloaded a shapefile of the world tectonic plates, but it might be more illuminating to use a digital elevation model to show underwater topography. These are all extensions for another day (and blog post).
To make this a finished product, I should add a title, a legend, provide attribution for data sources, and supply reproducibility fine-print (and maybe throw in a Copyright claim). However, it's not bad for a start.
The Imports
Just for completeness, here are the imports for the Notebook that holds all the code above (not all are by the code fragments above, and some are used only to support print-outs that define the environment for reproducibility purposes) :
    # all imports should go here

    import pandas as pd
    import sys
    import os
    import subprocess
    import datetime
    import platform
    import datetime

    import matplotlib.pyplot as plt
    #import seaborn as sb

    import  cartopy
    import cartopy.crs as ccrs
    from cartopy.io.img_tiles import OSM
    import cartopy.feature as cfeature
    from cartopy.io import shapereader
    from cartopy.io.img_tiles import StamenTerrain
    from cartopy.io.img_tiles import GoogleTiles
    from owslib.wmts import WebMapTileService

    from matplotlib.path import Path
    import matplotlib.patheffects as PathEffects
    import matplotlib.patches as mpatches

    from shapely.geometry import MultiLineString

    import numpy as np
The link to notebook that has all the code is will be coming soon.
Comment