Cartopy and Satellite Imaging
Cartopy and Satellite Images
So recently we had a bushfire near our village. Not a really big deal for us, but it threatened an industrial estate, and homes in a suburb a bit up the coast. It took the fire services a few days to put it completely out. From our street it looked like this:

So adhering to the motto, 'Satellite pics, or it didn't happen', I investigated to see if our burn could be seen from space.
Cartopy and NASA
Now, as I said before, one of the strengths of Cartopy is the easy integration of image data. Cartopy support access to Web Map Tile Servers; these are servers that take a URL request, and give youa map tile for you to use. Usually, the area, date and time, and content (including zoom level) are encoded in the URL in some way.
The service we will use is provided by NASA (a big shoutout to the American taxpayer), and serves data captured by MODIS (or Moderate Resolution Imaging Spectroradiometer). The Moderate Resolution means that the pixel size is about 200 metres on the ground (at best), but this service does have the advantage of being almost real time. Read about it here.
The Code
Imports
First, my set of standard Cartopy imports (not all of which will be used in the code fragments below).
    import pandas as pd
    import matplotlib.pyplot as plt

    import cartopy.crs as ccrs
    from cartopy.io.img_tiles import OSM
    import cartopy.feature as cfeature
    from cartopy.io import shapereader
    from cartopy.io.img_tiles import StamenTerrain
    from cartopy.io.img_tiles import GoogleTiles
    from owslib.wmts import WebMapTileService

    from matplotlib.path import Path
    import matplotlib.patheffects as PathEffects
    import matplotlib.patches as mpatches

    import numpy as np
Defining the WMTS we want
The code looks like:
    # URL of NASA GIBS
    URL = 'http://gibs.earthdata.nasa.gov/wmts/epsg4326/best/wmts.cgi'
    wmts = WebMapTileService(URL)

    # Layers for MODIS true color and snow RGB
    layers = ['MODIS_Terra_SurfaceReflectance_Bands143',
              'MODIS_Terra_CorrectedReflectance_Bands367']

    date_str = '2017-02-12'
The details are
-
We create a Web Map Tile Service instance, giving it the URL of the NASA server. The
epsg4326is code number for the projection of the data served back to us, and it's our old friend, Plate Carree (a.k.a. Geographic, Equidistant Cylindrical, Equirectangular). -
MODIS data comes in two layers, and layers[0] will be the one we want (close to false color); layer[1] is more for professional remote sensing, and not just gawking at the scenery as we will be doing.
-
Finally, we set up a date string; in this case I was asking for an image just after the fire. Note the
bestin the URL? NASA knows that an image 100% of clouds only is probably not very interesting, and in this case, we are asking for the 'best' image. I assume NASA algorithms have been pretty fine-tuned by now. As I understand it, this does mean that the date is an indicative date, and we might not get an image exactly on the date requested.
Defining Projections Used
    # Plot setup
    plot_CRS = ccrs.Mercator()
    geodetic_CRS = ccrs.Geodetic()
We will be plotting in Mercator, but our bounding boxes, etc, will be specified in lat/lon,
so for convenience we need to create a projection for these (Geodetic). We create two Cordinate Reference Systems
for later use.
Set up bounding box
    lat0 = -27
    lat1 = -26.4
    lon0 = 152.9
    lon1 = 153.5

    x0, y0 = plot_CRS.transform_point(lon0, lat0, geodetic_CRS)
    x1, y1 = plot_CRS.transform_point(lon1, lat1, geodetic_CRS)
    ysize = 8
    xsize = 2 * ysize * (x1 - x0) / (y1 - y0)
    fig = plt.figure(figsize=(xsize, ysize), dpi=100)
The lat0, lon0, etc are the lat/lons of the bounding box I want; I have to convert these using the CRS objects created
earlier. Finally, the transformed Mercator coordinates are used to set the aspect ratio of the figure we want.
Add the satellite image
    ax = plt.axes([0, 0, 1, 1], projection=plot_CRS)
    ax.set_xlim((x0, x1))
    ax.set_ylim((y0, y1))
    ax.add_wmts(wmts, layers[0], wmts_kwargs={'time': date_str})
We create an Axes object (notionally a square of side 1), but by specifying a projection, we drape the mantle of Cartopy across it. We set the X (longitude) and Y (latitude) limits, using the Mercator projection values. Finally, we request a Map Tile (or Map Tiles - Cartopy handles all that) from the NASA server. Cartopy munges the requested date, and layer, into the real URL that will be used to get the services.
Its all about me (or my lat/lon)
home_lat, home_lon = -26.5258277,153.0912987
# Add a marker for home
plt.plot(home_lon, home_lat, marker='o', color='red', markersize=5,
alpha=0.7, transform=ccrs.Geodetic())
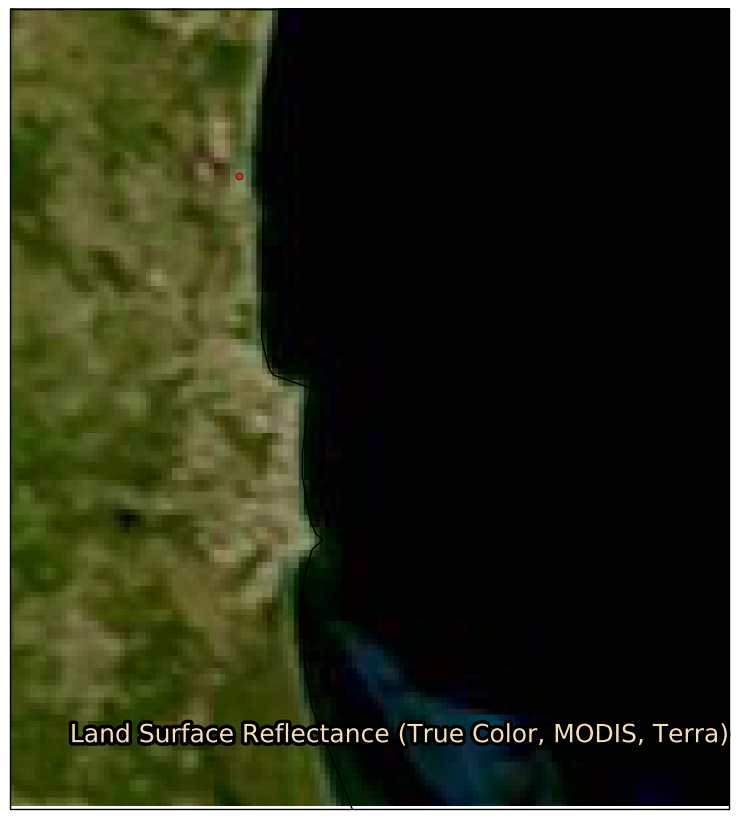
txt = plt.text(lon0+0.05, lat0+0.05, wmts[layers[0]].title, fontsize=18,
color='wheat', transform=geodetic_CRS)
txt.set_path_effects([PathEffects.withStroke(linewidth=5,
foreground='black')])
We specify a home lat/lon (with lots of spurious precision, thanks to Google Earth), plot a red circle, being careful to tell Cartopy that these are lat/lon, not Mercator units.
Then, we write text showing what NASA call the layer they have given us. We move 3 minutes of arc up and to the right of the bottom left corner of the map, write text (again, being careful to tell the underlying Axes object, that the start point is lat/lon, not Mercator). Finally, create a black background for the pale text so it will show out, regardless of the image color.
Show it!
    ax.coastlines('10m')


    plt.show()
Throw in some coastlines (that are pretty hard to see against the black ocean), and plot the result.
And if you look hard, there is indeed a brown mark to the north-west of my home!
Conclusion
More Cartopy goodness coming soon, including examples of different map tile servers.