GEEMAP and Australian Land Cover Datasets
Google Earth Engine and Australian Land Cover
Introduction
This is an example of using Google Earth Engine (GEE) , modified from the book:
EARTH ENGINE & GEEMAP: GEOSPATIAL DATA SCIENCE WITH PYTHON
There are lots of examples of how to use a Web Map Service, but one that I have seen a few times is the NLCD (the National Land Cover Database)
The NLCD is a 30-m Landsat-based land cover database spanning 8 epochs (2001, 2004, 2006, 2008, 2011, 2013, 2016, and 2019). A ninth epoch for 2021 is also available. The images rely on the imperviousness data layer for the urban classes and on a decision-tree classification for the rest.
Basically, Landsat data is use to classify every USA 30m pixel into one of many land cover categories.
Well, being a provincial Australian, I was tired of USA based examples. And Lo! there is a similiar product available for Australia, as shown below. However (as always), there a few wrinkles in using it.
Implementation
Load Notebook magics and packages
%load_ext lab_black
%load_ext watermark
All imports go here
import geemap
import ee

# use folium backend plotter
import geemap.foliumap as gf
import geemap.deck as gd

from IPython.display import IFrame
from IPython.display import Image, display
Mapping startup
Initialize GEE
ee.Authenticate()
True
ee.Initialize()
Access Land Cover WMS
A bit of Googling gives us the URLs for a WMS service, XML specification, and legend for a Land Cover for Australia from:
[https://services.ga.gov.au/gis/rest/services/Land_Cover_WM/MapServer]
More details of the service are contained in the XML specification:
[https://services.ga.gov.au/gis/services/Land_Cover_WM/MapServer/WMSServer?request=GetCapabilities&service=WMS]
The link:
[https://services.ga.gov.au/gis/services/Land_Cover_WM/MapServer/WMSServer?request=GetCapabilities&service=WMS]
contains the location of a LegendURL, pointing you to get the legend from [https://getcaps.gis.ga.gov.au/Land_Cover_WM/Land_Cover_WM_Land_Cover_Class_Legend.png]
We create a geemap Folium Map, and add a WMS layer. I have used image/png as the requested format, largely out of ignorance on which format is the most efficient. Available formats are:
image/bmp image/jpeg image/tiff image/png image/png8 image/png24 image/png32 image/gif image/svg+xml
Map7 = gf.Map(center=[-26.5269462, 153.0840185], zoom=4)
url = "https://services.ga.gov.au/gis/services/Land_Cover_WM/MapServer/WmsServer?"
Map7.add_wms_layer(
    url=url,
    layers="Land_Cover_Class",
    name="Land_Cover_Class",
    format="image/png",
    transparent=True,
)
Map display
Render the map in the Notebook
Map7
Now get the Legend
image_url = "https://getcaps.gis.ga.gov.au/Land_Cover_WM/Land_Cover_WM_Land_Cover_Class_Legend.png"
display(Image(url=image_url))
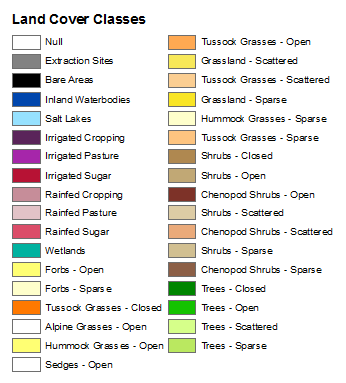
There is a problem here, in that if you wanted to create that legend programatically, you need the RGB values for each Land Cover Class name.
The only detailed description I could find of the Legend for Land Cover Classes was in
[https://d28rz98at9flks.cloudfront.net/83868/Dynamic_Land_Cover_Dataset_Product_Description_v2.1.pdf],
Dynamic Land Cover Dataset Product Description, V2.1 7 June 2017, D2017‐84360
As the Title suggests, this document covers DLDC V2.1, and seems to be missing some of the Land Cover Classes shown in the Legend graphic above. As the paper says:
The class numbers for DLCDv2 are consistent with DLCDv1
which contained several additional classes.
Howver, it does give a mapping from Legend class names (using ISO Class Descriptors) to class value, to RGB value, and these align with the Legend retrieved as a image.
It does look like the WMS is delivering the DLDCv1 land cover data (as the XML says in the Layer Abstract:
"compiled from the National Dynamic Land Cover Dataset from 2000 – 2008"
There is a document at [https://d28rz98at9flks.cloudfront.net/71069/Rec2011_031.pdf], The National Dynamic Land Cover Dataset Geoscience Australia, Record 2011/31, that does describe the first version of the DLCD. The categories described in this document match the Legend above, but there does not appear to be a Land Cover Class name to RGB color specification.
Of course, all may be specified in the ISO standard 2007 International Standards Organisation (ISO) land cover standard (19144‐2). ISO Standards are renowned for being locked up behind fierce pay-walls, and for being very expensive, so I didn't pursue that any further.
Example Legend
This is an example of how to add a legend to a geemap. We choose two of the land classes, and use the RBG values from the document referenced above, to create an example legend
Map8 = gf.Map(center=[-26.5269462, 153.0840185], zoom=4, fullscreen_ctrl=True)
url = "https://services.ga.gov.au/gis/services/Land_Cover_WM/MapServer/WmsServer?"
Map8.add_wms_layer(
    url=url,
    layers="Land_Cover_Class",
    name="Land_Cover_Class",
    format="image/png",
    transparent=True,
)

legend_dict = {"Salt Lakes": (150, 225, 255), "Closed Trees": (0, 133, 0)}

Map8.add_legend(
    title="Example Partial Legend", legend_dict=legend_dict, position="bottomleft"
)
Map8
Discussion
I gather that the WMS service has been superceded by the Digital Earth Australia Land Cover service [https://www.ga.gov.au/scientific-topics/dea/dea-data-and-products/dea-land-cover]. To quote:
Geoscience Australia is excited to announce the release of DEA Land Cover 2.0, incorporating the latest U.S. Geological Survey (USGS) Landsat data, including enhancements from Landsat 9, for improved accuracy and detail. This new version, available through the DEA Maps and the Digital Atlas of Australia offers greater understanding of Australia’s diverse landscapes over 35 years.
Still, it is nice to get an example of WMS land cover that isn't USA-centric.
Reproducability
%watermark
Last updated: 2025-08-25T12:43:13.030624+10:00

Python implementation: CPython
Python version       : 3.12.7
IPython version      : 8.29.0

Compiler    : MSC v.1941 64 bit (AMD64)
OS          : Windows
Release     : 11
Machine     : AMD64
Processor   : Intel64 Family 6 Model 170 Stepping 4, GenuineIntel
CPU cores   : 22
Architecture: 64bit
%watermark -co -iv -v -h
Python implementation: CPython
Python version       : 3.12.7
IPython version      : 8.29.0

conda environment: geospatial

Hostname: INSPIRON16

geemap : 0.35.1
IPython: 8.29.0
ee     : 1.3.1